Beyond the UI: Understanding Modern Frontend Engineering · Part 14
New to this series? Start with Part 1
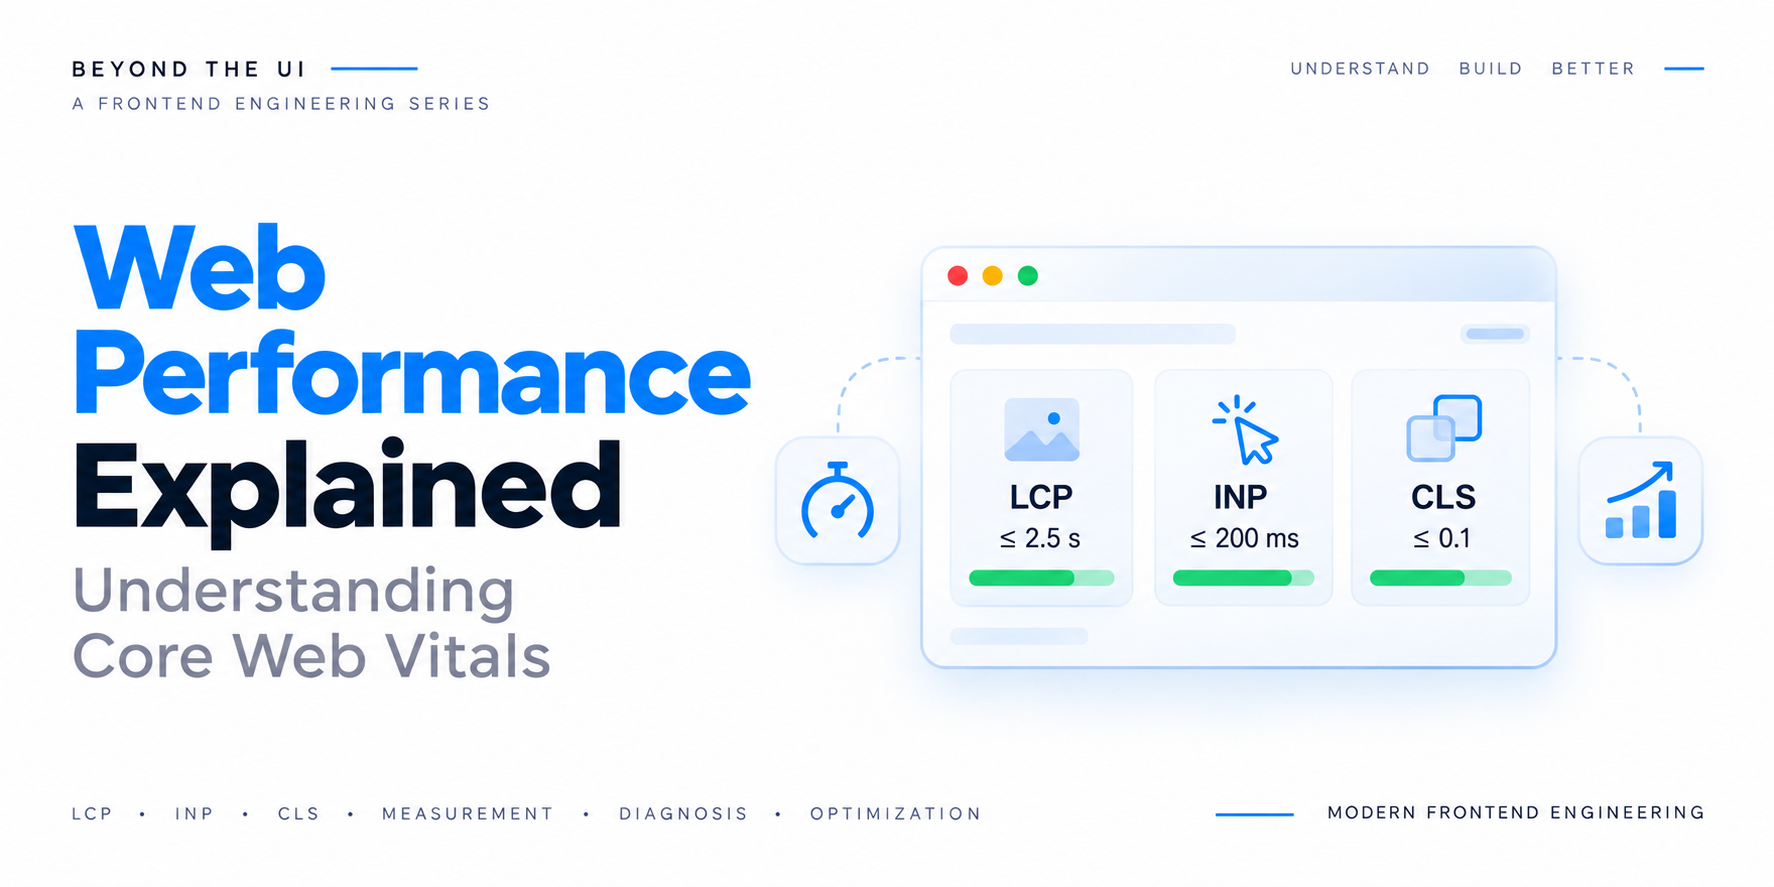
Web Performance Explained: Understanding Core Web Vitals
You open your application on your development machine, and everything feels fast. The homepage loads almost instantly, navigation is smooth, and interactions respond without noticeable delays. A Lighthouse audit returns a performance score of 96. Then a customer reports waiting several seconds before the page becomes usable, an interface that freezes when they click a button, and content that moves just as they are about to interact with it. You run the audit again, and the score is still 96.
The audit and the customer may both be accurately describing different experiences. An automated test measures a particular set of conditions, while real users encounter the application across different devices, network connections, geographic locations, browser configurations, and interaction patterns. A powerful laptop on reliable broadband can produce very different results from a mid-range smartphone with limited CPU resources and an unstable mobile connection.
Understanding those differences requires measuring more than page loading time. We need to know when meaningful content becomes visible, how quickly the interface responds to interactions, and whether content remains visually stable. Core Web Vitals help capture these experiences, but their values are starting points for an investigation.
A poor Largest Contentful Paint score might originate from server latency, render-blocking CSS, a late image request, or JavaScript delaying rendering. Poor Interaction to Next Paint might reflect expensive event handlers, long tasks, or unnecessary rendering, while Cumulative Layout Shift can reveal missing image dimensions, inserted content, or font changes. The challenge is connecting a poor experience to the browser work causing it.
In this final article of Beyond the UI, we’ll explore how Core Web Vitals are measured and how to use them to diagnose and improve the experiences that matter to real users.
1. Web Performance Is Not a Single Number
Describing an application as fast or slow can obscure the different experiences within a single visit. Consider a user opening an online banking dashboard and moving through this sequence:
1
2
3
4
5
6
7
8
9
10
11
12
13
14
15
16
17
18
19
20
21
22
User opens dashboard
        |
        v
Blank screen
        |
        v
Loading indicator appears
        |
        v
Account summary becomes visible
        |
        v
User clicks Transactions
        |
        v
Interface freezes briefly
        |
        v
Transactions appear
        |
        v
A late-loading banner shifts the page
The first visible pixel, the account summary appearing, the response to clicking Transactions, and the movement caused by the banner each describe a different aspect of performance. Measuring only one would leave part of the experience unexplained. A page can render its content quickly but respond poorly to interactions. Another page might take longer to display its main content but remain responsive once it appears. A third might load quickly and respond instantly, yet constantly shift content around the screen. This is why performance engineering needs multiple measurements. A useful mental model is:
1
2
3
4
5
6
7
8
9
10
11
12
13
14
15
16
17
Web Performance
      |
      +-- Loading Experience
      |       |
      |       +-- How quickly does useful content appear?
      |
      +-- Interaction Responsiveness
      |       |
      |       +-- How quickly does the interface respond?
      |
      +-- Visual Stability
      |       |
      |       +-- Does content remain where users expect?
      |
      +-- Resource Efficiency
              |
              +-- How much network, CPU, and memory are consumed?
Core Web Vitals focus primarily on the first three dimensions. They do not describe every aspect of performance, but they provide a useful foundation for evaluating user experience.
2. What Are Core Web Vitals?
Core Web Vitals are a set of user-centered performance metrics developed through Google’s web performance initiative. The three current Core Web Vitals are:
| Metric | Measures | Main question |
|---|---|---|
| Largest Contentful Paint (LCP) | Loading performance | When does the main content become visible? |
| Interaction to Next Paint (INP) | Interaction responsiveness | How quickly does the page visibly respond to user interactions? |
| Cumulative Layout Shift (CLS) | Visual stability | How much unexpected movement occurs? |
Each metric focuses on a different problem: LCP tracks the largest qualifying visible content element, INP evaluates responsiveness across qualifying interactions during a visit, and CLS measures unexpected layout movement. For practical assessment, the commonly used thresholds are:
| Metric | Good | Needs improvement | Poor |
|---|---|---|---|
| LCP | ≤ 2.5 seconds | > 2.5 to 4 seconds | > 4 seconds |
| INP | ≤ 200 ms | > 200 to 500 ms | > 500 ms |
| CLS | ≤ 0.1 | > 0.1 to 0.25 | > 0.25 |
These thresholds are generally evaluated at the 75th percentile of page visits, with mobile and desktop experiences considered separately. Looking beyond the average matters because an apparently healthy overall result can hide a substantial group of users with poor experiences.
3. Why the 75th Percentile Matters
Imagine measuring LCP across 100 page visits, ranging from powerful devices on excellent connections to older phones on slower networks. A simplified view of that range might look like this:
1
2
3
4
5
Fastest users             Slowest users
      |                         |
      v                         v

1.0s  1.2s  1.5s  1.8s  2.1s  2.4s  3.2s  4.1s  5.8s
An average can hide the fact that many users are experiencing poor performance. The 75th percentile, commonly written as p75, is the value at or below which approximately 75% of observations fall. If the p75 LCP is 3.2 seconds, approximately one-quarter of measured visits are slower than that value. This shifts attention toward the experience of users outside ideal development conditions.
P75 still leaves part of the distribution unexplained. A website can have acceptable p75 performance while a smaller group of users experiences severe problems. For important applications, it is also useful to inspect slower percentiles, device categories, network conditions, and geographic segments. These measurements help identify which users are struggling and why, giving the optimization work a specific experience to improve.
4. Largest Contentful Paint: When Does the Main Content Appear?
Largest Contentful Paint measures the time from the start of a page navigation until the largest qualifying content element in the viewport is rendered. Qualifying elements can include images, video poster images or video frames, and certain text-containing block elements. Consider an e-commerce product page:
1
2
3
4
5
6
7
8
9
10
11
+----------------------------------+
| Navigation                       |
+----------------------------------+
|                                  |
|       LARGE PRODUCT IMAGE        |
|                                  |
+----------------------------------+
| Product Name                     |
| Price                            |
| Add to Cart                      |
+----------------------------------+
The large product image may become the LCP element. If the image takes four seconds to render, the page’s LCP may be approximately four seconds, even if the navigation and smaller text appeared much earlier. Now consider a news article. The largest visible element might be a large heading or paragraph rather than an image. The important point is that LCP attempts to measure when substantial visible content becomes available. It is not necessarily the moment the entire page finishes loading.
Understanding the LCP timeline
A simplified sequence might look like:
1
2
3
4
5
6
7
8
9
10
11
12
13
14
15
16
17
18
19
20
21
22
Navigation begins
        |
        v
Server responds
        |
        v
HTML is parsed
        |
        v
Critical styles are available
        |
        v
Hero image is discovered
        |
        v
Hero image downloads
        |
        v
Image is decoded and rendered
        |
        v
Largest Contentful Paint
Every delay in this chain can affect LCP. A slow server postpones the browser’s work, late image discovery delays the request, and an unnecessarily large image takes longer to download. If the main thread is busy executing JavaScript, rendering may be delayed even after the image is available. This is why LCP optimization requires understanding the entire loading path.
5. Breaking Down LCP Into Its Components
For an image-based LCP element, a useful diagnostic model divides the total time into four components.
1
2
3
4
5
6
7
8
9
10
11
12
13
14
15
16
Navigation Start
      |
      v
Time to First Byte
      |
      v
Resource Load Delay
      |
      v
Resource Load Duration
      |
      v
Element Render Delay
      |
      v
LCP
Time to First Byte (TTFB)
TTFB measures the time until the first byte of the document response arrives. It can be influenced by network latency, server processing, redirects, and infrastructure.
Resource load delay
This is the time between receiving the initial document response and starting the LCP resource request. If the browser discovers a hero image only after executing JavaScript, this delay may be substantial.
Resource load duration
This is the time spent fetching the LCP resource. Large images and slow connections can increase this component.
Element render delay
This is the time between the resource finishing loading and the element being rendered. Render-blocking stylesheets, JavaScript execution, and other rendering dependencies may contribute. The decomposition is especially useful because different bottlenecks require different solutions. Reducing image file size will not solve a problem caused primarily by late image discovery. Optimizing the server will not necessarily fix an LCP delayed by expensive JavaScript. Good performance engineering starts by identifying where the time is actually being spent.
6. Improving LCP Through Resource Prioritization
One of the most common LCP mistakes is failing to prioritize the most important visual resource. Consider:
1
2
3
4
5
<img
  src="/images/hero.jpg"
  alt="Featured product"
  loading="lazy"
/>
Lazy loading is useful for images that are not immediately needed. But applying it to the primary above-the-fold image can delay the very content the user is waiting to see. For a critical hero image, an approach like this may be more appropriate:
1
2
3
4
5
6
7
<img
  src="/images/hero.webp"
  alt="Featured product"
  width="1200"
  height="700"
  fetchpriority="high"
/>
The fetchpriority attribute hints that this resource is important, helping the browser prioritize it without guaranteeing a particular scheduling outcome. If the image is discovered late, preloading may help:
1
2
3
4
5
<link
  rel="preload"
  as="image"
  href="/images/hero.webp"
/>
However, preloading should be selective. If developers preload too many resources, they compete for bandwidth and dilute the benefit of prioritization. The objective is to make the critical rendering path efficient. For a product page, that might mean prioritizing the main product image and essential styles while deferring analytics widgets, recommendation carousels, and other secondary features.
7. Why JavaScript Can Delay LCP
In earlier articles, we explored the browser rendering pipeline and the JavaScript event loop. Those concepts become especially important when diagnosing LCP. Consider a client-rendered application:
1
2
3
4
5
6
7
8
9
10
11
12
13
14
15
16
17
18
19
20
21
22
Browser downloads HTML
        |
        v
HTML contains minimal content
        |
        v
Download JavaScript
        |
        v
Parse and execute JavaScript
        |
        v
Initialize application
        |
        v
Fetch page data
        |
        v
Render main content
        |
        v
LCP
If the main content depends entirely on JavaScript execution, the browser may need to complete substantial work before it can render the largest content element. This does not mean client-side rendering is inherently slow. It means the initial rendering strategy determines which dependencies must complete before meaningful content appears. Server-side rendering or static generation may help expose meaningful HTML earlier. But those approaches introduce their own tradeoffs, including server work, hydration, caching, and data freshness. The important engineering question is: How much work must happen before the browser can render the content the user came to see? Reducing that work is often more valuable than optimizing unrelated parts of the application.
8. Interaction to Next Paint: Measuring Responsiveness
Loading is only the beginning of the experience. If a user clicks a transaction filter and waits 600 milliseconds for a visible response, the page feels sluggish even though its content has already loaded. Interaction to Next Paint, or INP, measures responsiveness to qualifying user interactions throughout a page visit. It considers interactions such as clicks, taps, and keyboard input.
INP is intended to capture a representative near-worst interaction latency, rather than simply averaging every interaction. For visits with relatively few interactions, the reported value may correspond to the slowest interaction. For visits with many interactions, the metric allows a small number of outliers. Measuring across the visit helps reveal applications that respond quickly to the first click but become slow after several minutes of use.
9. The Three Parts of Interaction Latency
An interaction’s latency can be understood through three main components.
1
2
3
4
5
6
7
8
9
10
11
12
13
User Interaction
        |
        v
Input Delay
        |
        v
Event Processing
        |
        v
Presentation Delay
        |
        v
Next Paint
Input delay
This is the time between the user interacting and the browser beginning to execute the relevant event callbacks. A busy main thread can increase input delay.
Processing duration
This is the time spent executing the event callbacks associated with the interaction. Expensive JavaScript can increase this component.
Presentation delay
This is the time between event processing and the browser presenting the next frame. Rendering work, layout calculations, and other main-thread activity can contribute. These components explain why optimizing an event handler alone may not solve every responsiveness problem. A click handler might execute quickly, but the resulting DOM update could trigger expensive layout and rendering work. Alternatively, the handler may be efficient, but a long-running task scheduled immediately before the interaction may delay it. Understanding INP requires looking at the complete interaction lifecycle.
10. Long Tasks and the Main Thread
JavaScript running on the browser’s main thread shares execution time with important rendering and interaction work. Consider:
1
2
3
4
5
6
7
8
9
function processTransactions(transactions) {
  let total = 0;

  for (const transaction of transactions) {
    total += expensiveCalculation(transaction);
  }

  return total;
}
If this function processes a large dataset synchronously, it may occupy the main thread for a substantial period. While that work runs, the browser may be unable to process other interactions promptly. A simplified timeline looks like:
1
2
3
4
5
6
7
8
9
10
11
12
Main Thread
------------------------------------------------

| Expensive JavaScript Task                  |
|                                            |
|                                            |
------------------------------------------------
                 ^
                 |
            User clicks

Click waits until the task completes
A task lasting more than 50 milliseconds is commonly classified as a long task in web performance tooling. That threshold is useful for identifying potentially disruptive work, but not every long task causes an equally poor user experience. A long task that occurs when nobody is interacting may have a different impact from one that blocks a critical button press. The key is to connect main-thread activity to actual interaction delays.
11. Breaking Up Expensive Work
One strategy for improving responsiveness is to divide large synchronous operations into smaller pieces. Consider:
1
2
3
4
5
function processAll(items) {
  for (const item of items) {
    processItem(item);
  }
}
If the collection is large, this loop may block the main thread. We can restructure it to yield periodically.
1
2
3
4
5
6
7
8
9
10
11
12
13
14
15
16
async function processInBatches(items, batchSize = 100) {
  for (let index = 0; index < items.length; index += batchSize) {
    const batch = items.slice(
      index,
      index + batchSize
    );

    for (const item of batch) {
      processItem(item);
    }

    await new Promise(resolve => {
      setTimeout(resolve, 0);
    });
  }
}
This approach gives the browser opportunities to handle other work between batches. However, setTimeout(..., 0) does not guarantee immediate execution or an optimal scheduling decision. The appropriate batch size depends on how expensive each item is. Modern browser scheduling APIs can provide more deliberate ways to yield, where supported. For example:
1
2
3
4
5
6
7
8
9
async function processItems(items) {
  for (const item of items) {
    processItem(item);

    if (globalThis.scheduler?.yield) {
      await scheduler.yield();
    }
  }
}
This is illustrative. Production implementations should account for browser support and avoid yielding after every trivial operation when batching would be more efficient. For truly CPU-intensive work, moving computation to a Web Worker may be a better architectural solution.
12. Web Workers and Main-Thread Responsiveness
Web Workers allow JavaScript to execute in a separate thread from the main document’s main thread. This can be useful for expensive computations that do not require direct DOM access. Imagine an analytics application processing 100,000 transactions to generate spending categories. If the entire computation runs on the main thread, the interface may become unresponsive. A worker-based architecture looks like:
1
2
3
4
5
6
7
8
9
10
Main Thread                     Web Worker
     |                               |
     |---- Transaction Data -------->|
     |                               |
     |                         Process Data
     |                               |
     |<---- Aggregated Results ------|
     |                               |
     v                               |
Render Dashboard                     |
A simplified worker:
1
2
3
4
5
6
7
8
9
10
11
// analytics-worker.js

self.onmessage = event => {
  const transactions = event.data;

  const result = aggregateTransactions(
    transactions
  );

  self.postMessage(result);
};
And on the main thread:
1
2
3
4
5
6
7
8
9
10
const worker = new Worker(
  new URL("./analytics-worker.js", import.meta.url),
  { type: "module" }
);

worker.postMessage(transactions);

worker.onmessage = event => {
  renderAnalytics(event.data);
};
Workers introduce communication and data-transfer costs that may outweigh the benefit for small computations. For substantial CPU-bound operations, however, they can help preserve main-thread responsiveness. This is a good example of performance optimization through architecture rather than micro-optimization.
13. Why Re-Renders Can Hurt INP
In Part 7 of this series, we explored how frontend state changes can trigger rendering work. That topic connects directly to INP. Consider a dashboard containing hundreds of components. A user changes a filter. The application updates state, and a large portion of the component tree performs unnecessary work. Even if the event handler itself is simple, the resulting update may be expensive. Conceptually:
1
2
3
4
5
6
7
8
9
10
11
12
13
14
15
16
User changes filter
        |
        v
State update
        |
        v
Many components re-render
        |
        v
DOM updates
        |
        v
Style and layout work
        |
        v
Next paint
The solution is not necessarily to memoize every component. As discussed in Part 8, memoization also has costs. Instead, developers should identify which updates cause expensive work and reduce unnecessary computation. Possible strategies include keeping state close to the components that need it, avoiding overly broad subscriptions, memoizing genuinely expensive derived values, virtualizing large lists, and reducing DOM complexity. The correct strategy depends on the source of the delay. If a slow interaction is caused by layout calculations, memoizing a JavaScript function may have little effect. If it is caused by repeated expensive computation, memoization may help significantly. Performance techniques become most effective when applied to a measured bottleneck.
14. Cumulative Layout Shift: When the Interface Moves Unexpectedly
Imagine reading an article when an advertisement loads above the paragraph, moving the text downward and interrupting your reading. Or perhaps you are about to click a button when a late-loading image pushes it out of position. These are examples of layout instability. Cumulative Layout Shift, or CLS, measures unexpected visual movement of elements within the viewport. A layout shift score is based on two factors:
1
2
3
Layout Shift Score
    =
Impact Fraction × Distance Fraction
The impact fraction describes the portion of the viewport affected by the shift, while the distance fraction describes how far the elements move relative to the viewport’s largest dimension. CLS accumulates layout shift scores using a session-window model, rather than simply adding every shift across an arbitrarily long page visit. The metric focuses on unexpected shifts. Layout shifts that occur shortly after certain user inputs may be excluded under the metric’s recent-input rules. However, a movement caused by an asynchronous operation long after the interaction may still count. This distinction matters because not every movement is inherently problematic. A user intentionally expanding an accordion expects content to move. An advertisement suddenly appearing above the content they are reading is a different experience.
15. Images Without Dimensions
One of the most common causes of layout shifts is failing to reserve space for images. Consider:
1
<img src="/images/product.jpg" alt="Product">
Before the image loads, the browser may not know how much space it should occupy. When the image dimensions become available, surrounding content can move. A better approach is:
1
2
3
4
5
6
<img
  src="/images/product.jpg"
  alt="Product"
  width="800"
  height="600"
/>
These attributes help the browser establish the image’s aspect ratio before the resource finishes loading. Responsive CSS can preserve the layout:
1
2
3
4
img {
  max-width: 100%;
  height: auto;
}
The same principle applies to videos, embedded content, and other asynchronously loaded elements. Reserve appropriate space whenever the dimensions are predictable. This is a small implementation detail with a potentially large effect on perceived quality.
16. Fonts and Layout Stability
Web fonts can also affect layout. Imagine a page initially rendering text using a fallback font. A custom font loads later. The browser replaces the fallback font, but the new font has different character widths and line heights. Text wraps differently, pushing nearby content downward. This can contribute to layout shifts. The font-loading strategy matters. For example:
1
2
3
4
5
6
@font-face {
  font-family: "App Sans";
  src: url("/fonts/app-sans.woff2")
    format("woff2");
  font-display: swap;
}
font-display: swap allows fallback text to appear while the custom font loads. This can improve perceived text availability, but the font swap may introduce layout changes. Developers can reduce this risk by choosing compatible fallback fonts, using appropriate font metrics, and avoiding unnecessary font files. In some cases, a system font stack may be a sensible performance and accessibility choice. Typography decisions need to account for fonts as resources with rendering and layout consequences.
17. Dynamic Content and Layout Shifts
Modern applications frequently insert content after the initial render. Examples include:
- Advertisements.
- Promotional banners.
- Recommendation widgets.
- Notifications.
- Lazy-loaded charts.
- Embedded videos.
- Personalized content.
If the application inserts these elements above existing content without reserving space, users may experience unexpected movement. Consider:
1
2
3
4
5
Initial Layout

Header
Main Content
Footer
Then:
1
2
3
4
5
6
After Asynchronous Update

Header
Promotional Banner
Main Content
Footer
The main content moves downward. A more stable design reserves a space for the banner or places the content where it does not unexpectedly displace the current reading position. For charts and widgets, skeleton placeholders can help preserve dimensions while data and code load. This connects directly to Part 12 on code splitting and lazy loading. Deferring a component can improve initial loading performance, but inserting it carelessly can worsen CLS. Performance optimizations are interconnected. Improving one metric can sometimes make another worse.
18. Laboratory Data vs Real-User Data
One of the most important distinctions in performance engineering is the difference between laboratory measurements and field measurements.
Laboratory measurements
Lab tools test an application under controlled conditions. Examples include Lighthouse and browser performance profiling. These tools are useful because they provide repeatable measurements and detailed diagnostic information. You can run a test, make a change, and compare the results. However, laboratory conditions are still simulations or controlled environments. They cannot represent every real user’s experience.
Field measurements
Field data comes from actual users interacting with a website. This is commonly called Real User Monitoring, or RUM. Field data reflects real devices, networks, browsers, and usage patterns. It can reveal problems that do not appear during local testing. The comparison looks like:
| Characteristic | Lab data | Field data |
|---|---|---|
| Environment | Controlled | Real-world |
| Reproducibility | Usually high | Naturally variable |
| Debugging detail | Often extensive | Depends on instrumentation |
| User coverage | Selected test conditions | Actual measured users |
| Best use | Diagnosing problems | Understanding real experience |
Used together, field data identifies where users are struggling and lab tools help investigate why.
19. Understanding Lighthouse Scores
Lighthouse is a useful auditing tool, but its performance score is not the same thing as Core Web Vitals field performance. A Lighthouse score is calculated from selected lab metrics and their weightings. It is influenced by the test environment, device simulation, network conditions, and the state of the page during the audit. A score of 100 does not guarantee that every real user will have a perfect experience. Likewise, a lower score does not automatically identify the most important production bottleneck. Lighthouse is best treated as a diagnostic tool.
It can help reveal excessive JavaScript, render-blocking resources, large images, long main-thread tasks, and other opportunities. But the score itself should not become the sole objective. Consider two engineering teams. Team A spends a week increasing a Lighthouse score from 94 to 98 on a rarely visited marketing page. Team B reduces severe interaction delays on the application’s primary checkout flow. Even if Team B’s Lighthouse score barely changes, its work may have a much greater impact on users. The goal is not to win a benchmark. The goal is to improve the experience.
20. Measuring Performance in Production
For production applications, performance monitoring should capture meaningful metrics across real visits. The web-vitals library provides a convenient way to collect Core Web Vitals measurements in supported environments. A simplified example:
1
2
3
4
5
6
7
8
9
10
11
12
13
14
15
16
17
18
19
20
21
import {
  onCLS,
  onINP,
  onLCP
} from "web-vitals";

function reportMetric(metric) {
  navigator.sendBeacon(
    "/api/performance",
    JSON.stringify({
      name: metric.name,
      value: metric.value,
      id: metric.id,
      rating: metric.rating
    })
  );
}

onCLS(reportMetric);
onINP(reportMetric);
onLCP(reportMetric);
This is an illustrative implementation. A production system should account for endpoint behavior, payload handling, user privacy, sampling, and how measurements are finalized or updated. The web-vitals library can report metric updates, and some measurements are only fully known as the page visit progresses or ends. For reliable analytics, the collection pipeline needs to handle those lifecycle details.
Useful dimensions to capture
Beyond the metric value itself, useful diagnostic dimensions may include:
- Page or route.
- Device category.
- Browser family.
- Connection characteristics where available.
- Application version.
- Geographic region at an appropriate privacy-preserving level.
- Whether the page was restored from the back-forward cache.
Avoid collecting unnecessary personal information. Performance monitoring should provide engineering insight without turning into invasive tracking.
21. Why Aggregated Metrics Can Hide Important Problems
Imagine an application with three major routes:
| Route | p75 LCP |
|---|---|
| Homepage | 1.6 s |
| Dashboard | 2.3 s |
| Reports | 5.2 s |
Suppose the homepage receives most of the traffic. An overall site-level metric might appear healthy even though the Reports page performs poorly. The same issue can occur across devices. Desktop users may experience excellent performance while mobile users struggle. This is why segmentation matters. Useful questions include:
- Which routes have the worst LCP?
- Which interactions produce the highest INP?
- Are layout shifts concentrated on particular templates?
- Do mobile users experience different bottlenecks?
- Did performance change after a deployment?
However, segmentation introduces another challenge. Smaller groups contain fewer observations. A p75 calculated from a handful of visits may be unstable. Performance dashboards should communicate sample sizes and avoid treating small differences as meaningful without sufficient data.
22. Diagnosing a Poor LCP Score
Suppose production monitoring reports that the dashboard’s p75 LCP is 4.8 seconds. Where do we start? A useful diagnostic process is:
1
2
3
4
5
6
7
8
9
10
11
12
13
14
15
16
17
18
19
20
21
22
23
24
25
26
27
28
Poor LCP
   |
   v
Identify LCP Element
   |
   v
Is TTFB High?
   |
   +-- Yes --> Investigate server/network
   |
   +-- No
         |
         v
Is Resource Discovery Late?
         |
         +-- Yes --> Fix discovery/priority
         |
         +-- No
               |
               v
Is Resource Download Slow?
               |
               +-- Yes --> Optimize resource
               |
               +-- No
                     |
                     v
Investigate Render Delay
For an image-based LCP, inspect the resource request timing. For a text-based LCP, investigate stylesheets, fonts, server response time, and main-thread rendering delays. If the content depends on client-side data fetching, examine when the fetch begins and whether it could start earlier. This investigation keeps changes focused on the dependency causing the delay. If the bottleneck is a slow API response, compressing an already small icon will not solve it. If the bottleneck is a hero image discovered after JavaScript execution, increasing database capacity may have little effect. Use the measurements to identify and optimize the relevant dependency.
23. Diagnosing a Poor INP Score
Now imagine users report that clicking a transaction filter causes the interface to freeze. Field monitoring shows poor INP on the dashboard. A useful investigation begins by identifying the slow interaction. Then inspect the interaction’s timing.
1
2
3
4
5
6
7
8
9
10
11
12
13
14
15
16
Slow Interaction
       |
       v
Input Delay?
       |
       +-- High --> Look for long tasks
       |
       v
Processing Duration?
       |
       +-- High --> Profile event handlers
       |
       v
Presentation Delay?
       |
       +-- High --> Inspect rendering/layout
Suppose the filter handler performs three operations:
1
2
3
4
5
6
7
8
9
10
11
12
function handleFilterChange(filter) {
  const filtered = filterTransactions(
    transactions,
    filter
  );

  const grouped = groupTransactions(
    filtered
  );

  renderTransactionTable(grouped);
}
A profiler can distinguish whether filtering, grouping, or rendering accounts for the delay. If grouping is expensive and repeated unnecessarily, memoization may help. If rendering thousands of rows is the bottleneck, virtualization may be more effective. If the main thread is blocked by unrelated background processing, scheduling or worker-based computation may be appropriate. Different causes require different solutions.
24. Diagnosing a Poor CLS Score
CLS investigation begins by identifying which elements move and what causes the movement. Browser developer tools can highlight layout shifts and help connect them to DOM changes. Common causes include images without reserved dimensions, injected banners, font swaps, and dynamically inserted widgets. A useful investigation might look like:
1
2
3
4
5
6
7
8
9
10
11
12
13
14
15
16
17
18
19
20
21
22
23
24
25
26
27
Poor CLS
   |
   v
Identify Moving Elements
   |
   v
What Changed Before the Shift?
   |
   +-- Image loaded
   |      |
   |      v
   |   Reserve dimensions
   |
   +-- Font swapped
   |      |
   |      v
   |   Review font metrics/loading
   |
   +-- Dynamic content inserted
   |      |
   |      v
   |   Reserve space or reposition
   |
   +-- Component expanded unexpectedly
          |
          v
       Review interaction timing
The element that moves is not always the element responsible for the shift. For example, a paragraph may move because an image above it loaded without reserved space. This distinction matters when interpreting layout shift diagnostics. Fix the cause, not merely the visible symptom.
25. Performance Budgets: Preventing Regressions
Performance optimization is easier when the application has clear expectations. A performance budget defines limits or targets for selected performance characteristics. For example:
| Area | Example budget |
|---|---|
| Initial JavaScript | Keep within a defined compressed transfer budget |
| Critical images | Enforce responsive sizes and modern formats |
| LCP | Target p75 ≤ 2.5 s |
| INP | Target p75 ≤ 200 ms |
| CLS | Target p75 ≤ 0.1 |
| Route transitions | Establish product-specific responsiveness targets |
The resource budgets should be based on the application’s actual needs rather than arbitrary universal limits. A complex analytics application may reasonably require more JavaScript than a simple informational website. The important part is making performance an explicit engineering constraint. A continuous integration pipeline might compare bundle sizes against a baseline. A release dashboard might monitor changes in field metrics after deployment. A team might investigate significant regressions before rolling out a new feature broadly. Performance budgets are useful because they turn performance from an occasional cleanup activity into an ongoing responsibility.
26. How Performance Techniques Interact
Throughout this series, we’ve explored several frontend engineering concepts. Many of them directly influence Core Web Vitals.
| Earlier topic | Performance connection |
|---|---|
| Browser rendering pipeline | Explains how content reaches the screen |
| Reflow and repaint | Helps diagnose rendering and layout costs |
| JavaScript event loop | Explains main-thread blocking and input delays |
| CSR vs SSR | Influences initial content availability |
| Hydration | Affects when server-rendered interfaces become interactive |
| State management | Influences update scope and rendering work |
| Re-renders | Can increase interaction processing and presentation delays |
| Memoization | Can reduce repeated expensive computation |
| Server state vs client state | Affects fetching, freshness, and UI consistency |
| Optimistic UI | Improves perceived response to asynchronous actions |
| Frontend caching | Reduces repeated network work and resource loading |
| Code splitting | Reduces initial JavaScript requirements |
| Accessibility | Helps ensure responsive interfaces remain usable across interaction methods |
These techniques influence one another, so their benefits depend on how they are applied. Code splitting can improve LCP by reducing initial JavaScript, yet delay the main content if a critical component is loaded too late. Server-side rendering can expose content earlier, while excessive hydration work can affect responsiveness.
The same tradeoffs apply after loading. Memoization can reduce expensive calculations but adds memory and coordination costs. Optimistic UI can provide immediate feedback, while expensive synchronous work from the same interaction can still produce poor INP. Evaluating the whole interaction helps determine whether a change improves the experience overall.
27. A Realistic Optimization Scenario
Consider a financial analytics dashboard with the following production measurements.
| Metric | Initial p75 |
|---|---|
| LCP | 4.6 s |
| INP | 380 ms |
| CLS | 0.19 |
The team wants to improve all three.
Step 1: Investigate LCP
The dashboard’s main summary panel is rendered only after a large JavaScript bundle initializes and fetches account data. The team introduces a more efficient initial rendering strategy, reduces unnecessary JavaScript, and starts critical data loading earlier. The main content becomes visible sooner.
Step 2: Investigate INP
Interaction traces show that filtering transactions causes expensive grouping operations and renders thousands of table rows. The team moves heavy aggregation out of the critical interaction path and virtualizes the transaction list. The filter becomes more responsive.
Step 3: Investigate CLS
Layout shift diagnostics show that charts appear after their data loads, pushing the transaction table downward. The team reserves chart dimensions and stabilizes the loading layout. Unexpected movement decreases. After deployment, the team measures production performance again. An illustrative outcome might be:
| Metric | Before | After |
|---|---|---|
| LCP | 4.6 s | 2.3 s |
| INP | 380 ms | 170 ms |
| CLS | 0.19 | 0.07 |
These hypothetical results illustrate the process rather than guarantee an outcome. Each change addresses a measured cause, and real-user data establishes whether the experience improved after deployment.
28. Common Web Performance Mistakes
Several mistakes repeatedly undermine performance efforts.
Optimizing only for Lighthouse
A high laboratory score does not guarantee good field performance. Use Lighthouse for diagnosis, but validate important improvements against real-user experience.
Treating every slow page as a JavaScript problem
Poor LCP may originate from server latency, resource discovery, or network conditions. Not every performance problem is caused by frontend execution.
Optimizing average performance only
Averages can hide users experiencing severe delays. Inspect distributions, percentiles, and meaningful segments.
Lazy-loading critical resources
Deferring important content can worsen loading performance. Lazy loading should reflect actual resource priority.
Memoizing everything
Memoization introduces costs and does not automatically improve responsiveness. Measure expensive computations before adding caching.
Ignoring layout stability
A page can load quickly while remaining frustrating to use because elements move unexpectedly.
Confusing perceived performance with measured responsiveness
Optimistic UI can improve perceived feedback, but it does not eliminate expensive main-thread work.
Testing only on powerful devices
Development machines rarely represent the full range of production conditions. Test on realistic hardware and network configurations.
Failing to monitor regressions
Performance can deteriorate gradually as features and dependencies accumulate. Monitoring and budgets help prevent this.
29. Building a Sustainable Performance Engineering Process
Performance should not depend on one engineer periodically running an audit. It should be part of how the team builds and maintains the application. A practical workflow looks like:
1
2
3
4
5
6
7
8
9
10
11
12
13
14
15
16
17
18
19
20
21
22
23
24
25
26
27
28
Collect Real-User Metrics
          |
          v
Identify Problematic Experiences
          |
          v
Segment by Route and Device
          |
          v
Reproduce in Lab
          |
          v
Profile the Bottleneck
          |
          v
Implement Targeted Change
          |
          v
Validate in Lab
          |
          v
Deploy
          |
          v
Verify with Field Data
          |
          v
Monitor for Regression
This process creates a feedback loop: real-user measurements identify the problem, laboratory tools help explain it, and engineering changes address the cause. Production monitoring then establishes whether the experience improved and continues to reveal regressions as the application evolves.
For large frontend applications, this feedback loop also helps coordinate work across teams and dependencies. A marketing script added to the homepage can influence LCP. A new component library can increase JavaScript processing costs. A seemingly harmless layout change can introduce CLS. A new analytics feature can create long main-thread tasks. Performance is a shared architectural responsibility.
Bringing It All Together
Core Web Vitals give us a practical way to discuss three important dimensions of user experience. Largest Contentful Paint helps us understand when meaningful content becomes visible. Interaction to Next Paint helps us understand whether the application responds promptly when users interact with it. Cumulative Layout Shift helps us understand whether the interface remains visually stable.
Interpreting these metrics requires understanding the browser behavior behind them. LCP connects to network requests, resource discovery, rendering, and JavaScript execution. INP connects to the event loop, main-thread scheduling, event handlers, state updates, and rendering work. CLS connects to layout calculations, resource dimensions, fonts, and dynamically inserted content. Together, they form a bridge between low-level browser behavior and real user experience.
1
2
3
4
5
6
7
8
9
10
11
12
13
14
15
16
17
18
19
20
21
22
23
24
25
26
27
28
29
30
31
32
33
User Experience
       |
       v
Core Web Vitals
       |
       +-- LCP
       |     |
       |     +-- Network
       |     +-- Resource Priority
       |     +-- Rendering
       |
       +-- INP
       |     |
       |     +-- Main Thread
       |     +-- JavaScript
       |     +-- State Updates
       |     +-- Rendering Work
       |
       +-- CLS
             |
             +-- Layout
             +-- Resource Dimensions
             +-- Fonts
             +-- Dynamic Content
       |
       v
Measure and Diagnose
       |
       v
Targeted Optimization
       |
       v
Better Real-User Experience
Performance emerges from how the entire frontend system behaves, so each optimization needs to be evaluated within that system.
Final Thoughts
Throughout this series, we’ve explored what happens beneath the visible interface. The rendering pipeline, reflow, repaint, and event loop explain how content reaches the screen and why some operations are expensive. Rendering strategies and hydration determine when that content becomes visible and interactive, while state management, re-renders, and memoization shape the work required as it changes.
Server-state management, optimistic UI, and caching help us reason about responsiveness, consistency, and freshness. Code splitting reduces the JavaScript needed upfront, and accessibility ensures that people can use the interface through different interaction methods. Core Web Vitals connect these decisions to measurable experiences, giving us evidence of where the system works well and where it needs attention.
Understanding those connections helps us ask more useful questions. Which resources are critical to the current experience? Where is the main thread spending its time, and what is delaying the next paint? Which users encounter the worst performance, and does a proposed change improve their experience? Answering those questions requires observations from real use alongside controlled tests and profiling.
Good frontend engineering combines an understanding of browser behavior with evidence from the people using the application. That combination helps us build interfaces that remain fast, reliable, accessible, and maintainable as they evolve.
Closing the Series: Beyond the UI
This brings us to the end of Beyond the UI: Understanding Modern Frontend Engineering: fourteen articles exploring the engineering beneath the interfaces we build every day. Frameworks, libraries, and development tools will continue to change, but the principles behind browser behavior, resource costs, state ownership, and human interaction remain useful across those changes.
Browsers still need to parse, execute, and render. Networks introduce latency, application state needs consistency, and users need reliable interactions across different devices, connections, and abilities. Understanding these constraints gives us a foundation for investigating failures, recognizing tradeoffs, and making deliberate engineering decisions.
If there is one idea I hope readers take away from this series, it is that the best frontend engineers understand both how to build an interface and why it behaves the way it does. Thank you for following Beyond the UI. Keep questioning what happens beneath the pixels; those questions lead to much of the engineering that makes an interface work well.